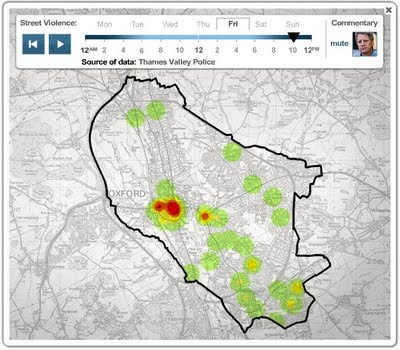
Cool Infographics points to a nice GIS page on the BBC which shows crime data for the city of Oxford using heatmaps to map various crime patterns over a one year period. Check it out.


Cool Infographics points to a nice GIS page on the BBC which shows crime data for the city of Oxford using heatmaps to map various crime patterns over a one year period. Check it out.
