Check out this great blog highlights a project developed by the Tutor/Mentor Connection to “creates maps that look at the relationship among poverty, community resources, school performance, and locations of non-school tutoring/mentoring facilities for K-12 students.”
Category Archives: Online Mapping
Canadian Census Maps
This is something new from Statistics Canada today.
The Atlas of Canada, produced by Natural Resources Canada in partnership with Statistics Canada, presents a series of maps and accompanying analysis of national and regional data results from the 2006 Census. The first releases focus on Canadian population, age, marital status, immigration, visible minorities and mode of transportation. The maps are available on the Atlas of Canada website (http://atlas.nrcan.gc.ca/site/english/maps/population.html).
Future releases will cover topics such as educational attainment, the labour force, languages, housing and income.

Visible Minority Population 2006
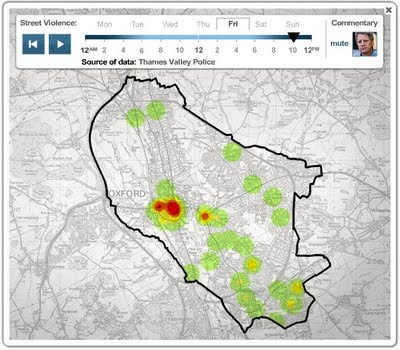
Crime Heatmaps From the BBC
Cool Infographics points to a nice GIS page on the BBC which shows crime data for the city of Oxford using heatmaps to map various crime patterns over a one year period. Check it out.
Mapping for Health Advocates
The Opportunity Agenda, with support from the Health Policy Institute at the Joint Center for Political and Economic Studies, commissioned a series of papers that explore best practices for integrating maps into health advocacy, using case studies to present key strategies for effective use and overcoming technical hurdles.
Using Maps to Promote Health Equity
RoundUp of Google Maps-based Mapmaking Apps
Webware has the list here.
From the article:
“Google Maps is dynamic. Making customized maps through the service isn’t very difficult. But there are a variety of third-party tools on the Web that help you create fully customized Google Maps mashups. From Flickr geotag integration to wedding event mapping to just doodling, you can do it all.”