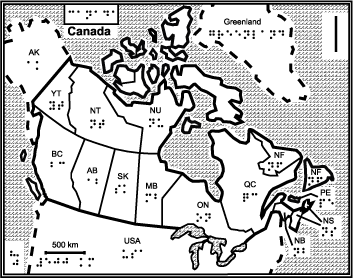
Presenting spatial information to those who cannot see is not, as you might think at first glance, a lost cause: a section of Natural Resources Canada’s web site is dedicated to providing (and researching methods of providing) maps for the blind. Most are extremely low-resolution, and make little or no use of colour: these are tactile maps, meant to be felt — with the lines and letters enhanced with a thermal enhancer — or seen by people with limited vision. Lines are thick; symbols are large; information density is by necessity limited. The site has a section on mapping procedures — how to make such maps. And the research section has interesting material on audio-tactile haptic maps — maps that make sounds relevant to what you pass over, read out names of streets and buildings and so forth (some examples). Via The Map Room
Author Archives: GANIS
Schoolchildren to Map Light Pollution
Schoolchildren around the world will gaze skyward from March 8 to 21 in an effort to help scientists map light pollution. They will be looking for specific constellations, then share their observations through the Internet. The program, called GLOBE at Night, is designed to both help scientists map light pollution while educating kids about the stars, according to BBS News.
Last year, more than 18,000 people from 96 countries on every continent except Antarctica reported a total of more than 4,500 observations as part of the program. GLOBE at Night is a project of The GLOBE Program (Global Learning and Observations to Benefit the Environment), a worldwide science and education program managed by the University Corporation for Atmospheric Research and Colorado State University.
Outdoor lighting is a growing problem for astronomical observing programs around the world. By having students in many places hunt for the same constellation, GLOBE at Night will allow students to compare their observations with what others see, giving them a sense of how light pollution varies from place to place.
Courtesy of GeoCarta
Update Canada’s Topo Maps
Until February 28th, the Ministry of Finance is calling for input on its budget priorities. As with the campaign for the print topographic maps last fall, it is important to make our politicians aware that it is necessary to keep topographic maps of Canada up-to-date.
Input into the government’s budget priorities is an important step to raise the awareness of mapping. If you agree please submit 50 words or less to the Ministry of Finance’s online pre-budget consultations, in the priority category: Other.
Sample statement:
The Government of Canada must ensure complete and up-to-date topographic maps of Canada by Natural Resources Canada to: defend our sovereignty and security in the face of global realities, support our search and rescue teams, monitor Canada’s environmental and natural resources base.
Link to a Min. Finance Response Area – http://www.mapsforcanadians.ca/budget.htm
Link to a Template letter – http://www.mapsforcanadians.ca/letter.htm
See much more here – www.mapsforcanadians.ca for more information.
Post courtesy of serendipityoucity
Electoral Geography
Electoral Geography is a website database of almost every modern election for every country. If you are an election map junkie, this is a very dangerous and wonderful place. Where else can you find, under one roof, choropleth maps of the election results for Madagascar’s presidential election of 2006 and maps and data on Canadian elections, including the first federal election of 1867. Of course, you can check out your favourite country and see the results.
Mapping Economic Activity
The G-Econ project maps the world’s economic activity on a one-degree grid. Animations for the entire globe are available, as are maps of individual countries and data sets. The country maps reveal an unsurprising correlation between economic activity and population or industrial centres. Check out the map of Canada below.